The Power of Online Reviews for Small Businesses
The Power of Online Reviews for Small Businesses As a small business owner, you may be wondering why online reviews are so important. Online reviews

Five Most Important SEO Metrics
The Five Most Important SEO Metrics I recently came across the HubSpot State of Marketing report which showed how companies measure the success of their
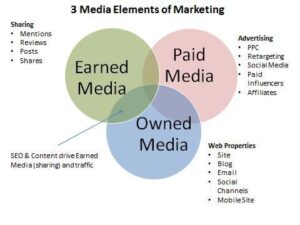
The Three Traffic Sources For Startups
The Three Traffic Sources For Startups I was recently re-reading Randall Stross’s book, The Launch Pad: Inside Y Combinator, Silicon Valley’s Most Exclusive School for
SEO: The Key to Sustainable Business Growth
SEO: The Key to Sustainable Business Growth Search Engine OptimizationIn today’s digital landscape, businesses can no longer afford to underestimate the power of search engine
Vermont Web Design
Springfield802.com Partners with Braveheart Digital Marketing to Enhance Online Presence Springfield802.com, the premier digital platform for Springfield, Vermont, today announced a partnership with Braveheart Digital

AI In Digital Marketing
Mastering AI in Digital Marketing Today, the digital world changes fast, thanks to new tech. In this landscape, Artificial Intelligence (AI) is a big deal,