
Definitive Guide To Building Your Brand Presence on Twitter
How to Build a Brand on X in 2026: Strategies, Case Studies, and What Actually Works X (formerly Twitter) has had more changes in the
4 Reasons to Keep Advertising (Even When Others Cut Back)
Why Businesses That Keep Advertising Win — Even When Others Pull Back It sounds counterintuitive: when revenue slows or uncertainty rises, the instinct is to

5 Common Meta Ads Mistakes That Waste Your Budget
The Most Costly Facebook Ads Mistakes (and How to Fix Each One) https://www.youtube.com/watch?v=kZ1wHgLLSCcYou’ve set up the campaign. You’ve written the copy. You’ve hit publish. And
Answer Engine Optimization
Answer Engine Optimization (AEO): How to Earn Visibility in the Age of AI Answers https://www.youtube.com/watch?v=deOL5KUtkjc As AI-driven platforms like Google’s Search Generative Experience (SGE), OpenAI’s ChatGPT, Perplexity,

Harnessing the Power of AI for Small Business Marketing
Harnessing the Power of AI for Small Business Marketing https://www.youtube.com/watch?v=deOL5KUtkjcThe marketing world is rapidly evolving with the advent of AI, revolutionizing how businesses, particularly small

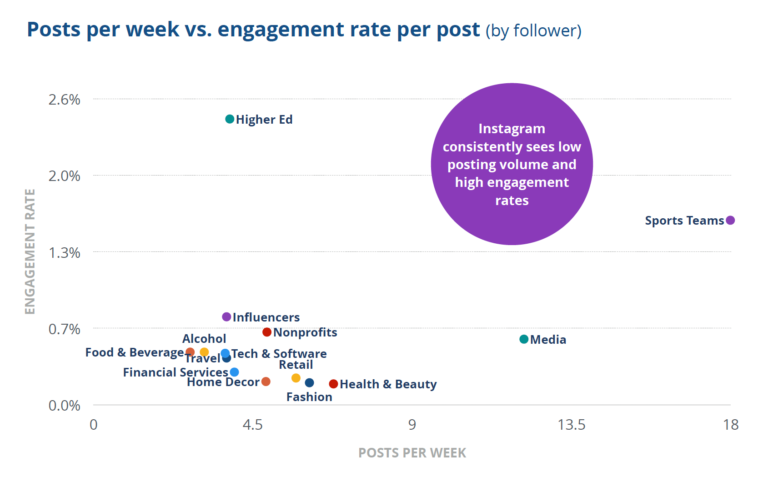
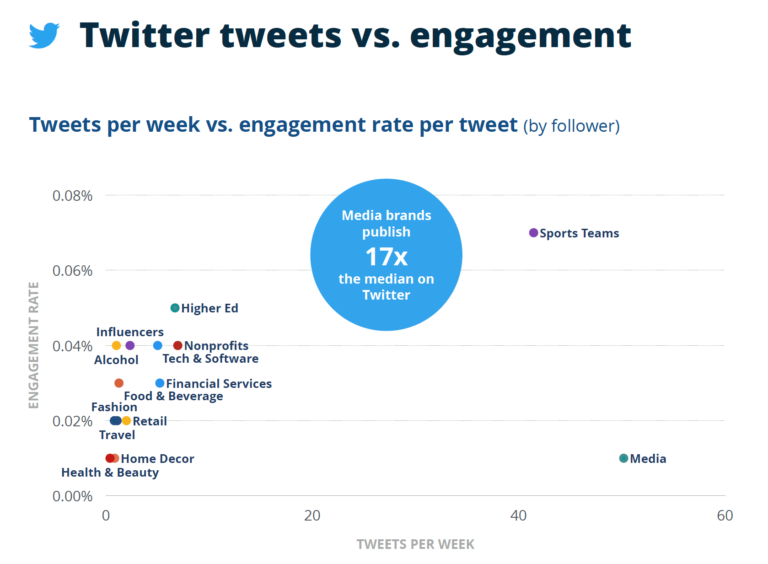
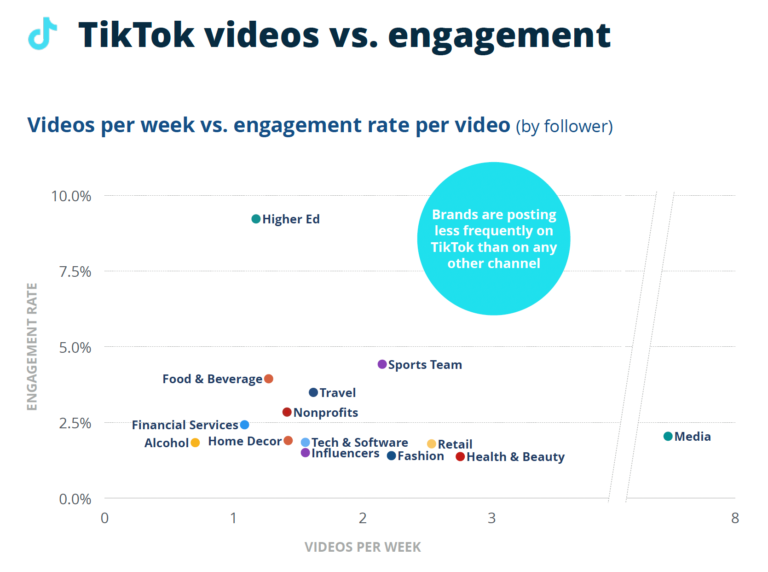
How Many Social Media Platforms Should You Focus On?
How Many Social Media Platforms Should Your Business Use in 2026? The short answer: two to three platforms, done well, will consistently outperform five or