
Local SEO AI Search
Directories, Yelp, and the Future of Local SEO in AI Search: Artificial intelligence is already changing the way search engines surface local business information. Instead
What Is Geofencing?
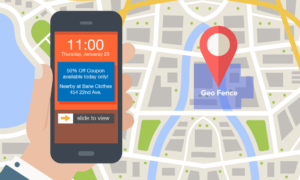
What is Geofencing? Geofencing marketing is location-based ads where a user’s location is recorded via the internet, and advertisements are only shown to people in
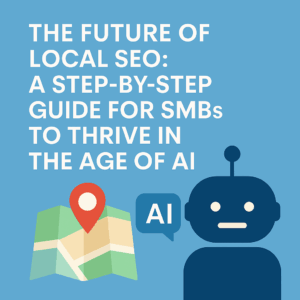
Local SEO Playbook
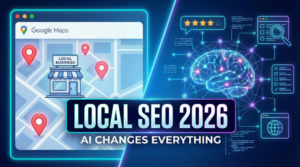
The 2026 Local SEO Playbook for SMBs For small and medium-sized businesses (SMBs), being visible in local search results has always been essential to attracting

PPC in 2026
The Top 5 Questions About Google & Meta Ads Paid media has changed more in the last 12 months than in the last decade.If you

SEO in 2026
SEO in 2026 – The 5 SEO Questions Every Business Owner Is Asking If you are still doing SEO the way you did in 2023,

5 Common Meta Ads Mistakes That Waste Your Budget
5 Common Meta Ads Mistakes That Waste Your Budget (and How to Fix Them) Meta Ads (Facebook and Instagram advertising) remain some of the most